Simple, Clear & Actionable
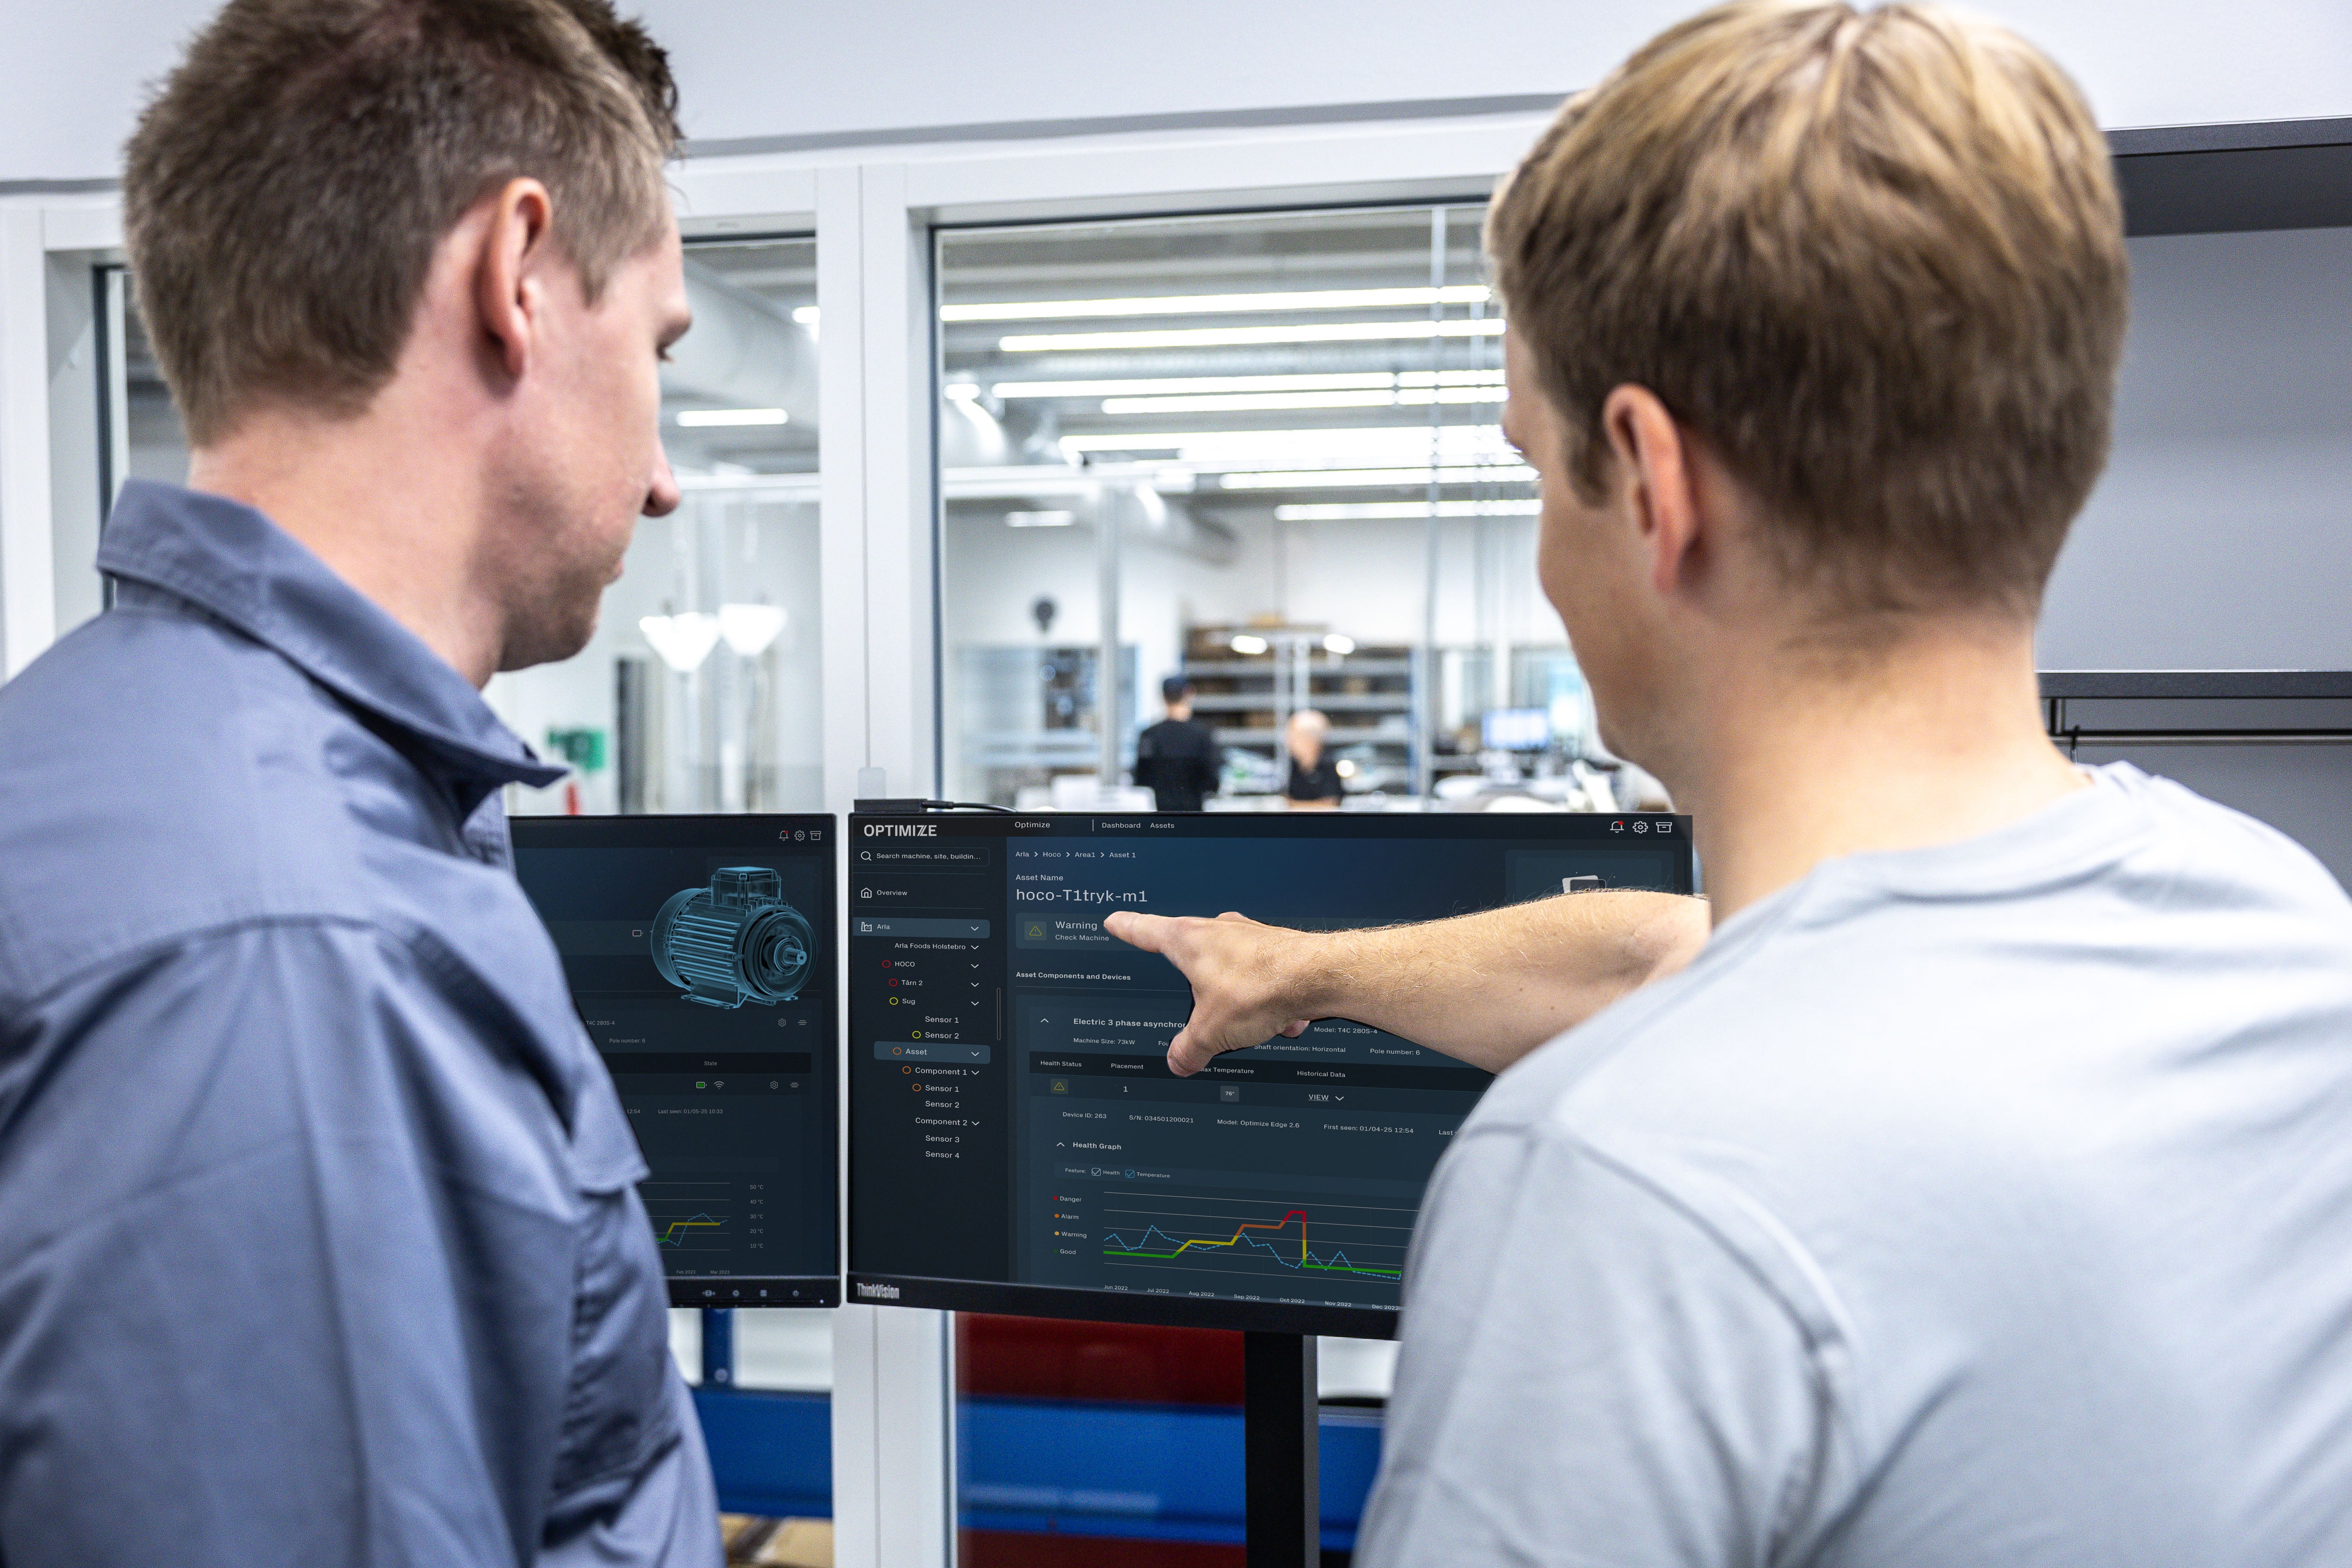
The Optimize Dashboard is designed for simplicity: an intuitive interface that makes it easy to get a clear overview of your machines. At a glance, you see the most important health indicators - so you can quickly decide what action to take.
Behind the simple view lies a powerful system that combines continuous sensing, edge analytics, and cloud integration. Instead of reacting to failures, you gain early visibility into degradation patterns and emerging defects — reducing downtime and extending asset life. With advanced tools like FFT, HFFT, and bearing diagnostics, the dashboard provides deep insights into machine health, while alerts and historical trends are easily accessible online or via API integration.
Proven Benefits
1. Financial Results
- Reduced unplanned downtime: Cut downtime by up to 30-50% and avoid costly production stops.
- Lower maintenance costs: Save 10-40% compared to reactive repairs by addressing issues early.
- Extended asset lifetime: Prevent over-maintenance and catastrophic failures, lowering capital expenditure.
- High ROI: Every $1 invested in predictive maintenance can return $5–$10.
2. Production Output
- Higher equipment availability: Keep machines running at peak performance and boost OEE.
- Stable production flow: Minimize disruptions for reliable throughput and on-time delivery.
- Optimized scheduling: Plan service during low-demand periods, reducing production impact.
3. Employee Well-Being
- Less stress and overtime: Avoid emergency breakdowns and last-minute repairs.
- Safer work environment: Detect risks early and prevent accidents from equipment failures.
- Stronger engagement: Enable teams to shift from firefighting to data-driven decision-making.
Data Transparency
Data is the foundation for reliable predictions – but it always remains your property.
Our database is built with the highest level of security, ensuring full protection and complete separation of individual data sets. With this structure, we can also provide clients with a full copy of their raw data upon request.
Because no customer should ever be denied access to their own data.
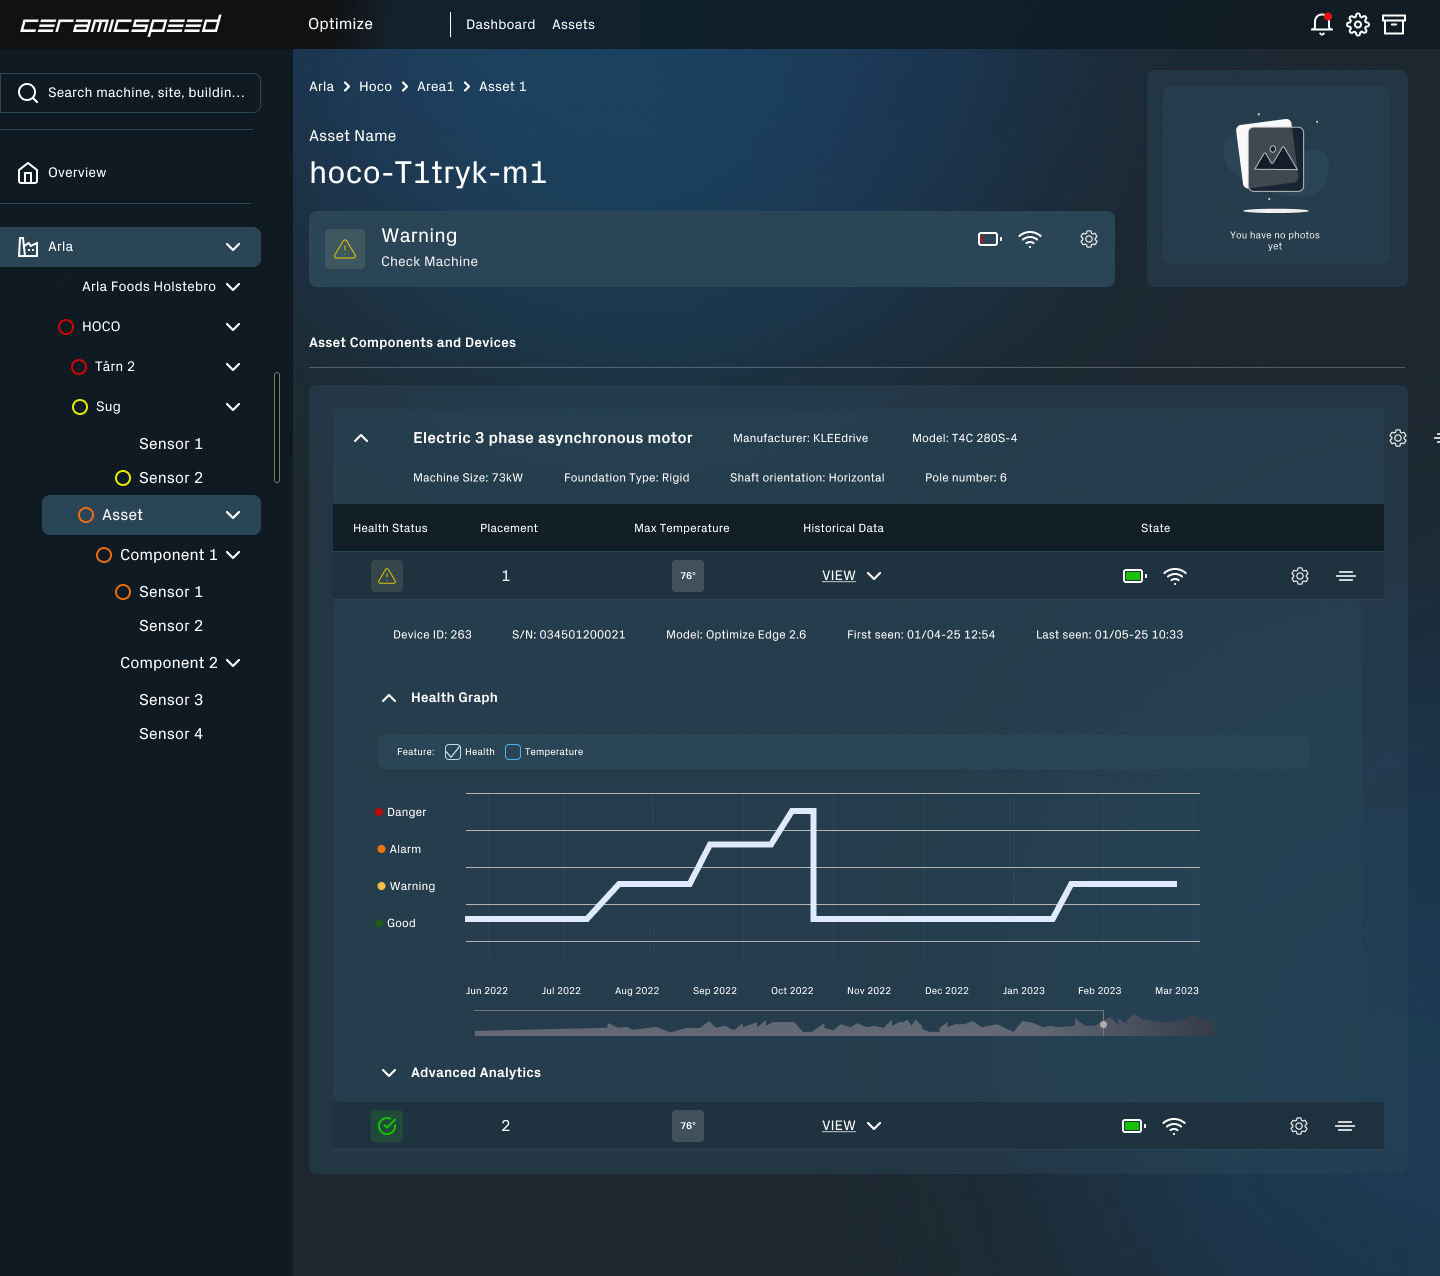
Machine Health Made Visible
The Optimize Dashboard displays the development of the machine health score. The health score classifies the machine state into Good, Warning, Alarm, and Danger.
- In Warning and Alarm, the machine is running in a suboptimal state, where corrective actions may be possible.
- In Alarm, attention should be directed at the machine, and service planning should
be considered. - In Danger, the machine must not be operated for extended periods, and immediate action is required.
- The health score is based on ISO-defined vibration levels.